
Skip to main contentSkip to main content
Back to Blog
Peptide Testing

How to Read an HPLC Peptide Purity Report

A field guide to reading HPLC chromatograms and purity tables on a peptide COA — retention time, area percent, related substances, and the peaks reviewers actually check.

July 7, 2026
Last reviewed

# How to Read an HPLC Peptide Purity Report

An HPLC purity report looks intimidating the first time. It is a small set of numbers and one chart, and once you know what each is for, it becomes routine.

The chromatogram

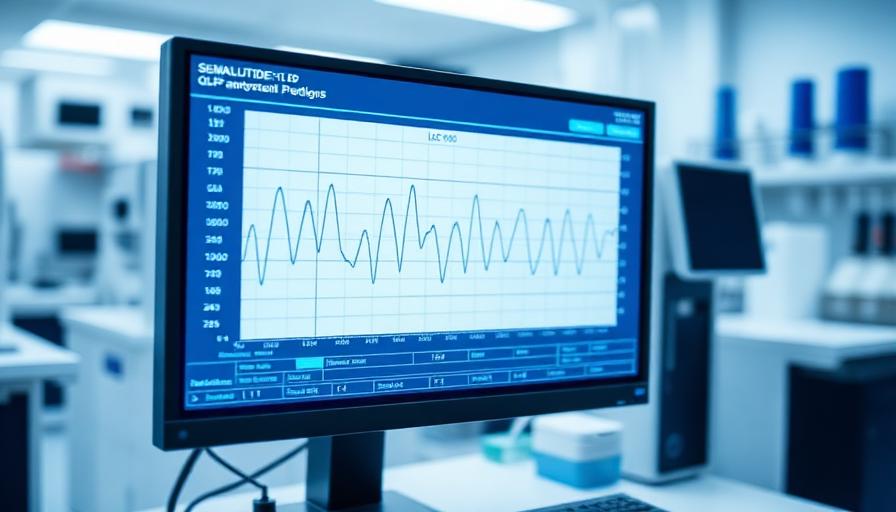
The chart is signal (usually UV absorbance at 214 nm or 220 nm) plotted against time. Each peak is a compound eluting off the column. A well-resolved chromatogram for a research peptide has:

  • A large main peak — the peptide of interest.
  • Small related substance peaks — synthesis byproducts, deletion sequences, oxidation products.
  • An injection front near time zero and possibly a solvent peak — ignore these for purity math.

The purity number

Purity is reported as area percent: the main peak's integrated area divided by the total integrated area of all peaks in the analysis window, times 100. A 98.5% purity means 1.5% of the UV-absorbing material in the sample is not the target peptide.

Two nuances:

  1. Area % is not mass %. Different impurities have different UV extinction coefficients.
  2. The analysis window matters. Peaks eluting outside the integration window are not counted. Reports should disclose the integration window.

Below the chromatogram, a good COA lists each significant impurity peak by retention time and area %. If the table just says "Total impurities: 1.5%" without breaking peaks out, the report is hiding information. Individual impurities matter — a single 0.7% oxidation peak has different implications than seven 0.2% peaks.
Need Your Peptides Tested?

ACS Peptide Testing Labs provides fast, accurate HPLC purity testing, mass spectrometry identity confirmation, and comprehensive Certificate of Analysis.

Method block

Every real HPLC report discloses column chemistry and dimensions, mobile phase composition, gradient, flow rate, detection wavelength, injection volume, and column temperature. Without this block, the number cannot be reproduced. If you cannot reproduce it, you cannot audit it.

Sanity checks

  • Retention time consistency across reference lots.
  • Peak shape — a symmetrical main peak is healthy. Fronting or tailing suggests overload or column degradation.
  • Baseline — should be flat between peaks.

What a reviewer flags

  • Main peak below 95% for compounding pharmacy release.
  • Any single impurity above 0.5% for regulated workflows.
  • A "purity" number without a related substances breakdown.
  • A chromatogram with no method disclosed.
  • A single-injection number with no replicate mean or RSD.

The number by itself is not the deliverable — the number plus the method plus the impurity table is the deliverable.

Related Resources

Frequently Asked Questions

Ready to Verify Your Peptide Quality?

Get professional testing from a US-based laboratory. HPLC purity, mass spectrometry identity, contaminant screening with fast turnaround and comprehensive documentation.